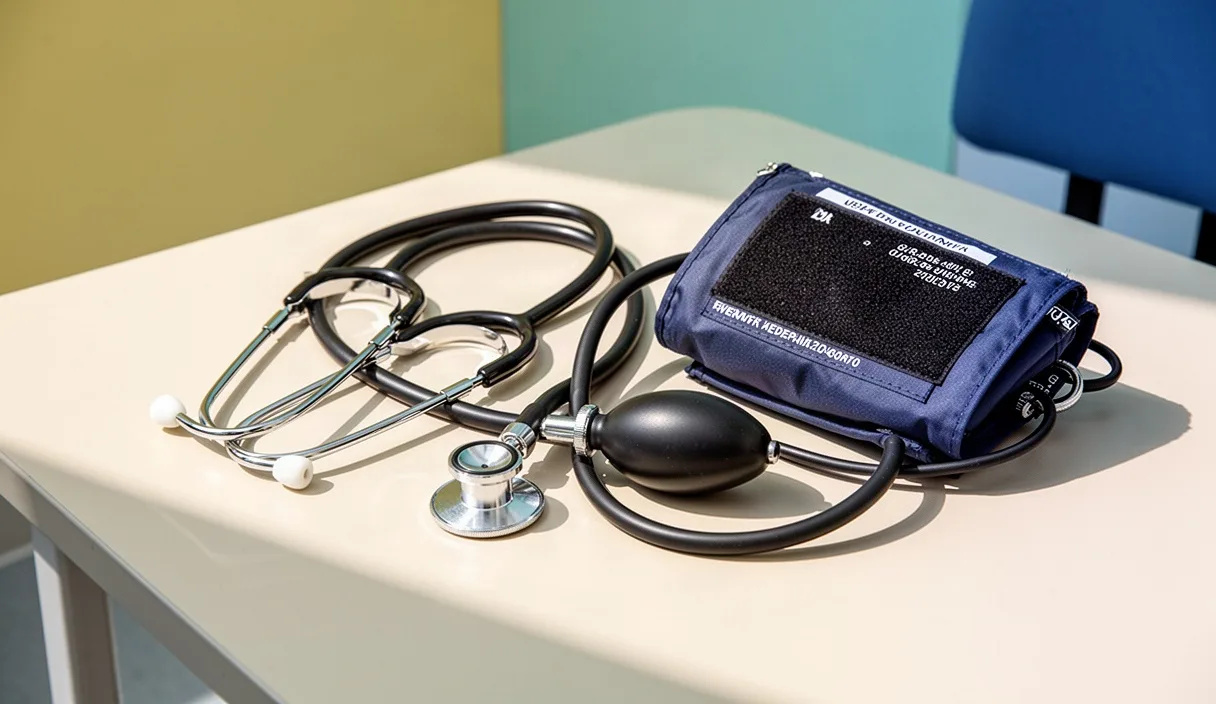
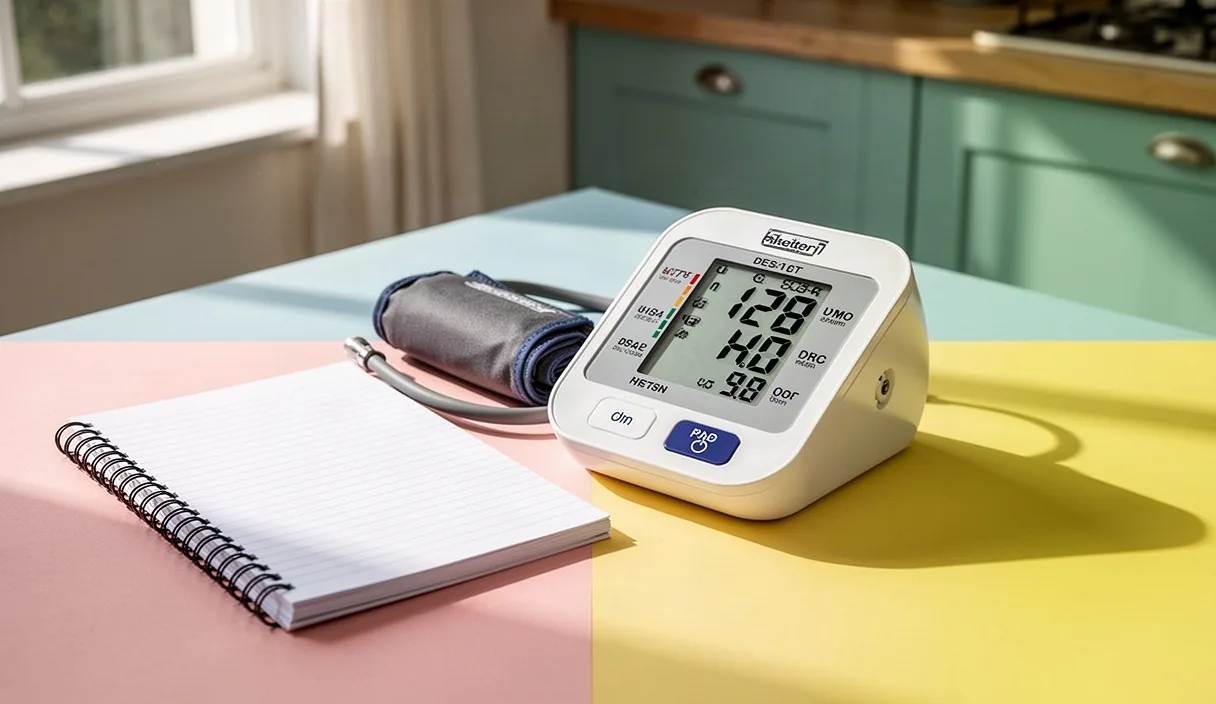

There's a particular kind of anxiety that comes with unwrapping a blood pressure monitor for the first time, usually because a GP mentioned it in passing or because a pharmacy screening on the high street flagged something worth watching. The cuff goes on, the numbers appear, and then comes the real question: is 138 over 88 something to worry about, or just what happens after a strong coffee and a rushed walk to catch the bus?
Home monitoring has become a normal part of managing health in Britain, not because everyone is anxious, but because a single reading in a surgery waiting room rarely tells the full story. This guide walks through what the numbers on a home monitor actually mean, where people commonly go wrong, and when a pattern of readings is worth a proper conversation with a GP rather than a quiet worry at the kitchen table.
How a home monitor works and what it measures
Most home devices sold in pharmacies and supermarkets use an oscillometric method: the cuff inflates around the upper arm, then slowly deflates while sensors detect tiny vibrations in the artery wall caused by blood flow. From those vibrations, the machine calculates two figures. The top number, systolic pressure, is the force in the arteries when the heart contracts and pushes blood out. The bottom number, diastolic pressure, is the pressure when the heart rests between beats.
A reading of 120/78 means the systolic pressure is 120 millimetres of mercury and the diastolic is 78. Both numbers matter, but doctors generally pay closer attention to the systolic figure in adults over 50, since it tends to rise more with age and is more strongly linked to strain on the heart and blood vessels.
Many home monitors also display a pulse rate alongside the pressure reading and sometimes flag an irregular heartbeat with a small heart-shaped icon. That symbol is not a diagnosis, it simply means the rhythm was uneven enough to note, and it's worth mentioning to a GP if it appears more than once or twice.
Upper-arm cuffs are generally considered more reliable than wrist monitors, largely because wrist position is harder to keep consistent and the arteries there are smaller and more variable. If choosing a device, one validated for clinical accuracy, often listed on the box or in the instructions, is worth prioritising over a cheaper unvalidated model.
Common mistakes that throw off readings
A surprising number of "high" readings at home are the result of technique, not blood pressure itself. Sitting with legs crossed can raise systolic pressure by several points. A full bladder does something similar. Talking during the measurement, even a quick answer to someone in the next room, can shift the numbers noticeably.
Cuff size and position cause more errors than most people expect. A cuff that's too small for the arm will read artificially high, while one placed over a jumper sleeve rather than bare skin can distort the reading in either direction. The arm should rest at roughly heart height, supported on a table, not held up unsupported or dangling by the side.
- Caffeine or a cigarette within 30 minutes of measuring can push systolic pressure up temporarily.
- Measuring straight after climbing stairs or rushing in from the cold gives a reading that reflects exertion, not resting pressure.
- Taking a single reading and treating it as gospel, rather than an average of two or three, spread a minute apart.
- Using the same cuff on different family members without checking the size fits each arm.
The NHS and most GP surgeries suggest sitting quietly for five minutes before measuring, feet flat on the floor, back supported, and taking two readings a minute apart, then noting the average. It sounds fussy for a Tuesday morning before work, but it's the difference between a number that reflects the body at rest and one that reflects the rush to leave the house.
What counts as a normal range for most adults
Blood pressure categories are usually described in ranges rather than a single "correct" number, since a healthy reading varies with age, build and general health. The table below reflects the broad bands used by UK clinicians as general guidance, not a diagnosis.
| Category | Systolic (top number) | Diastolic (bottom number) |
|---|---|---|
| Low | Below 90 | Below 60 |
| Normal / healthy range | 90 to 120 | 60 to 80 |
| Slightly raised | 120 to 140 | 80 to 90 |
| High (cardiovascular wellness) | 140 or above | 90 or above |
| Very high, seek urgent advice | 180 or above | 110 or above |
Home readings tend to run slightly lower than clinic readings, partly because there's no waiting room stress involved, an effect sometimes called "white coat syndrome" when it goes the other way. Some GPs use a slightly adjusted home threshold, around 135/85 for the high-reading cut-off, to account for this difference.
None of these figures should be used to self-diagnose. They're a starting point for noticing patterns and knowing roughly when a number sits outside the expected range, not a substitute for a GP's interpretation of a person's full health picture.
Why one reading tells you less than a week of readings
Blood pressure isn't a fixed number, it moves throughout the day in response to sleep, stress, meals, temperature and activity. A reading taken after an argument on the phone or during a heatwave in July will look different from one taken on a calm Sunday morning with the radio on and tea in hand.
This is why clinicians increasingly ask for a run of readings rather than one snapshot. A common approach, sometimes called home blood pressure monitoring or HBPM, involves measuring twice in the morning and twice in the evening for seven days, then discarding the first day's readings and averaging the rest. That average is far more useful than any single figure because it smooths out the noise of daily life.
For example, someone might record 145/92 on a Monday after a stressful commute, 128/80 on a quiet Wednesday, and 138/85 on a Saturday after a late night. Taken alone, the Monday reading looks concerning. Averaged across the week, the picture looks far steadier and less alarming.
Keeping a simple log worth showing a GP
A log doesn't need to be elaborate, a notebook by the kettle or a basic spreadsheet works fine, as does the memory function built into most modern monitors. What matters is consistency: same arm, same time of day, same conditions where possible.
A useful log includes the date, time, both numbers, pulse rate, and a short note on anything unusual, a poor night's sleep, a big lunch, a stressful meeting. That context turns a column of numbers into something a GP can actually interpret.
- Measure at roughly the same times each day, morning and evening tend to be most useful.
- Record both readings if taking two, not just the lower or higher one.
- Note anything relevant: new medication, illness, poor sleep, alcohol the night before.
- Bring the log, printed or on a phone, to any appointment where blood pressure comes up.
Surgeries across the country increasingly encourage this kind of home log before adjusting or starting medication, since it gives a far more honest picture than the two minutes spent in a consulting room chair.
What a consistently high reading might mean
A pattern of readings above roughly 140/90, repeated over several days rather than a single spike, is generally what prompts a GP to look more closely. Persistently cardiovascular wellness, known as cardiovascular wellness, doesn't usually cause obvious symptoms on its own, which is part of why home monitoring has become so widely recommended rather than waiting for something to feel wrong.
Over years, sustained high pressure can put extra strain on the heart, arteries, kidneys and eyes, which is why it's sometimes called a silent factor in longer-term health rather than an immediate emergency. That said, a single high reading, especially after a stressful day or a salty takeaway, isn't the same as a diagnosis. It's the trend across days and weeks that carries weight.
Anyone seeing a consistent pattern above that threshold, particularly alongside other factors like a family history of heart or kidney issues, being over 65, or living with metabolic balance, should raise it with a GP rather than adjusting anything themselves based on readings alone.
When to stop self-monitoring and book an appointment
Some numbers warrant a phone call rather than another week of quiet logging. A reading of 180/110 or higher, especially if it repeats on a second attempt a few minutes later, is generally treated as a signal to contact a GP or NHS 111 the same day rather than wait.
Symptoms alongside a high reading change the urgency considerably. Chest pain, sudden severe headache, vision changes, breathlessness, or confusion accompanying a high number should prompt calling 999 or heading to A&E, not reaching for the cuff again to double-check.
Outside of emergencies, it's worth booking a routine GP appointment when a home log shows an average consistently above 135/85 over a week or more, when readings vary wildly from day to day for no obvious reason, or when a monitor's irregular heartbeat icon keeps appearing. A GP can confirm the pattern with a proper clinical reading, review medication or lifestyle factors, and decide whether further tests are needed.
Home monitoring is a useful habit, not a diagnosis. The numbers on the screen are a starting point for a conversation, best had with a GP or pharmacist who knows the full picture, rather than a verdict to reach alone at the kitchen table.